Understanding Insights
Once your assessment is live, you need to know how the class is performing. Tandem provides real-time insights to help you identify struggling students and check the quality of your questions.
At a glance
Open the Insights tab on any assessment to see a high-level summary of performance.
- Class Average: A quick way to check if the assessment was too hard or too easy.
- Time Spent: See how long students are taking on average vs. the limit you set.
- Completion Rate: Track how many students have submitted vs. those still working.
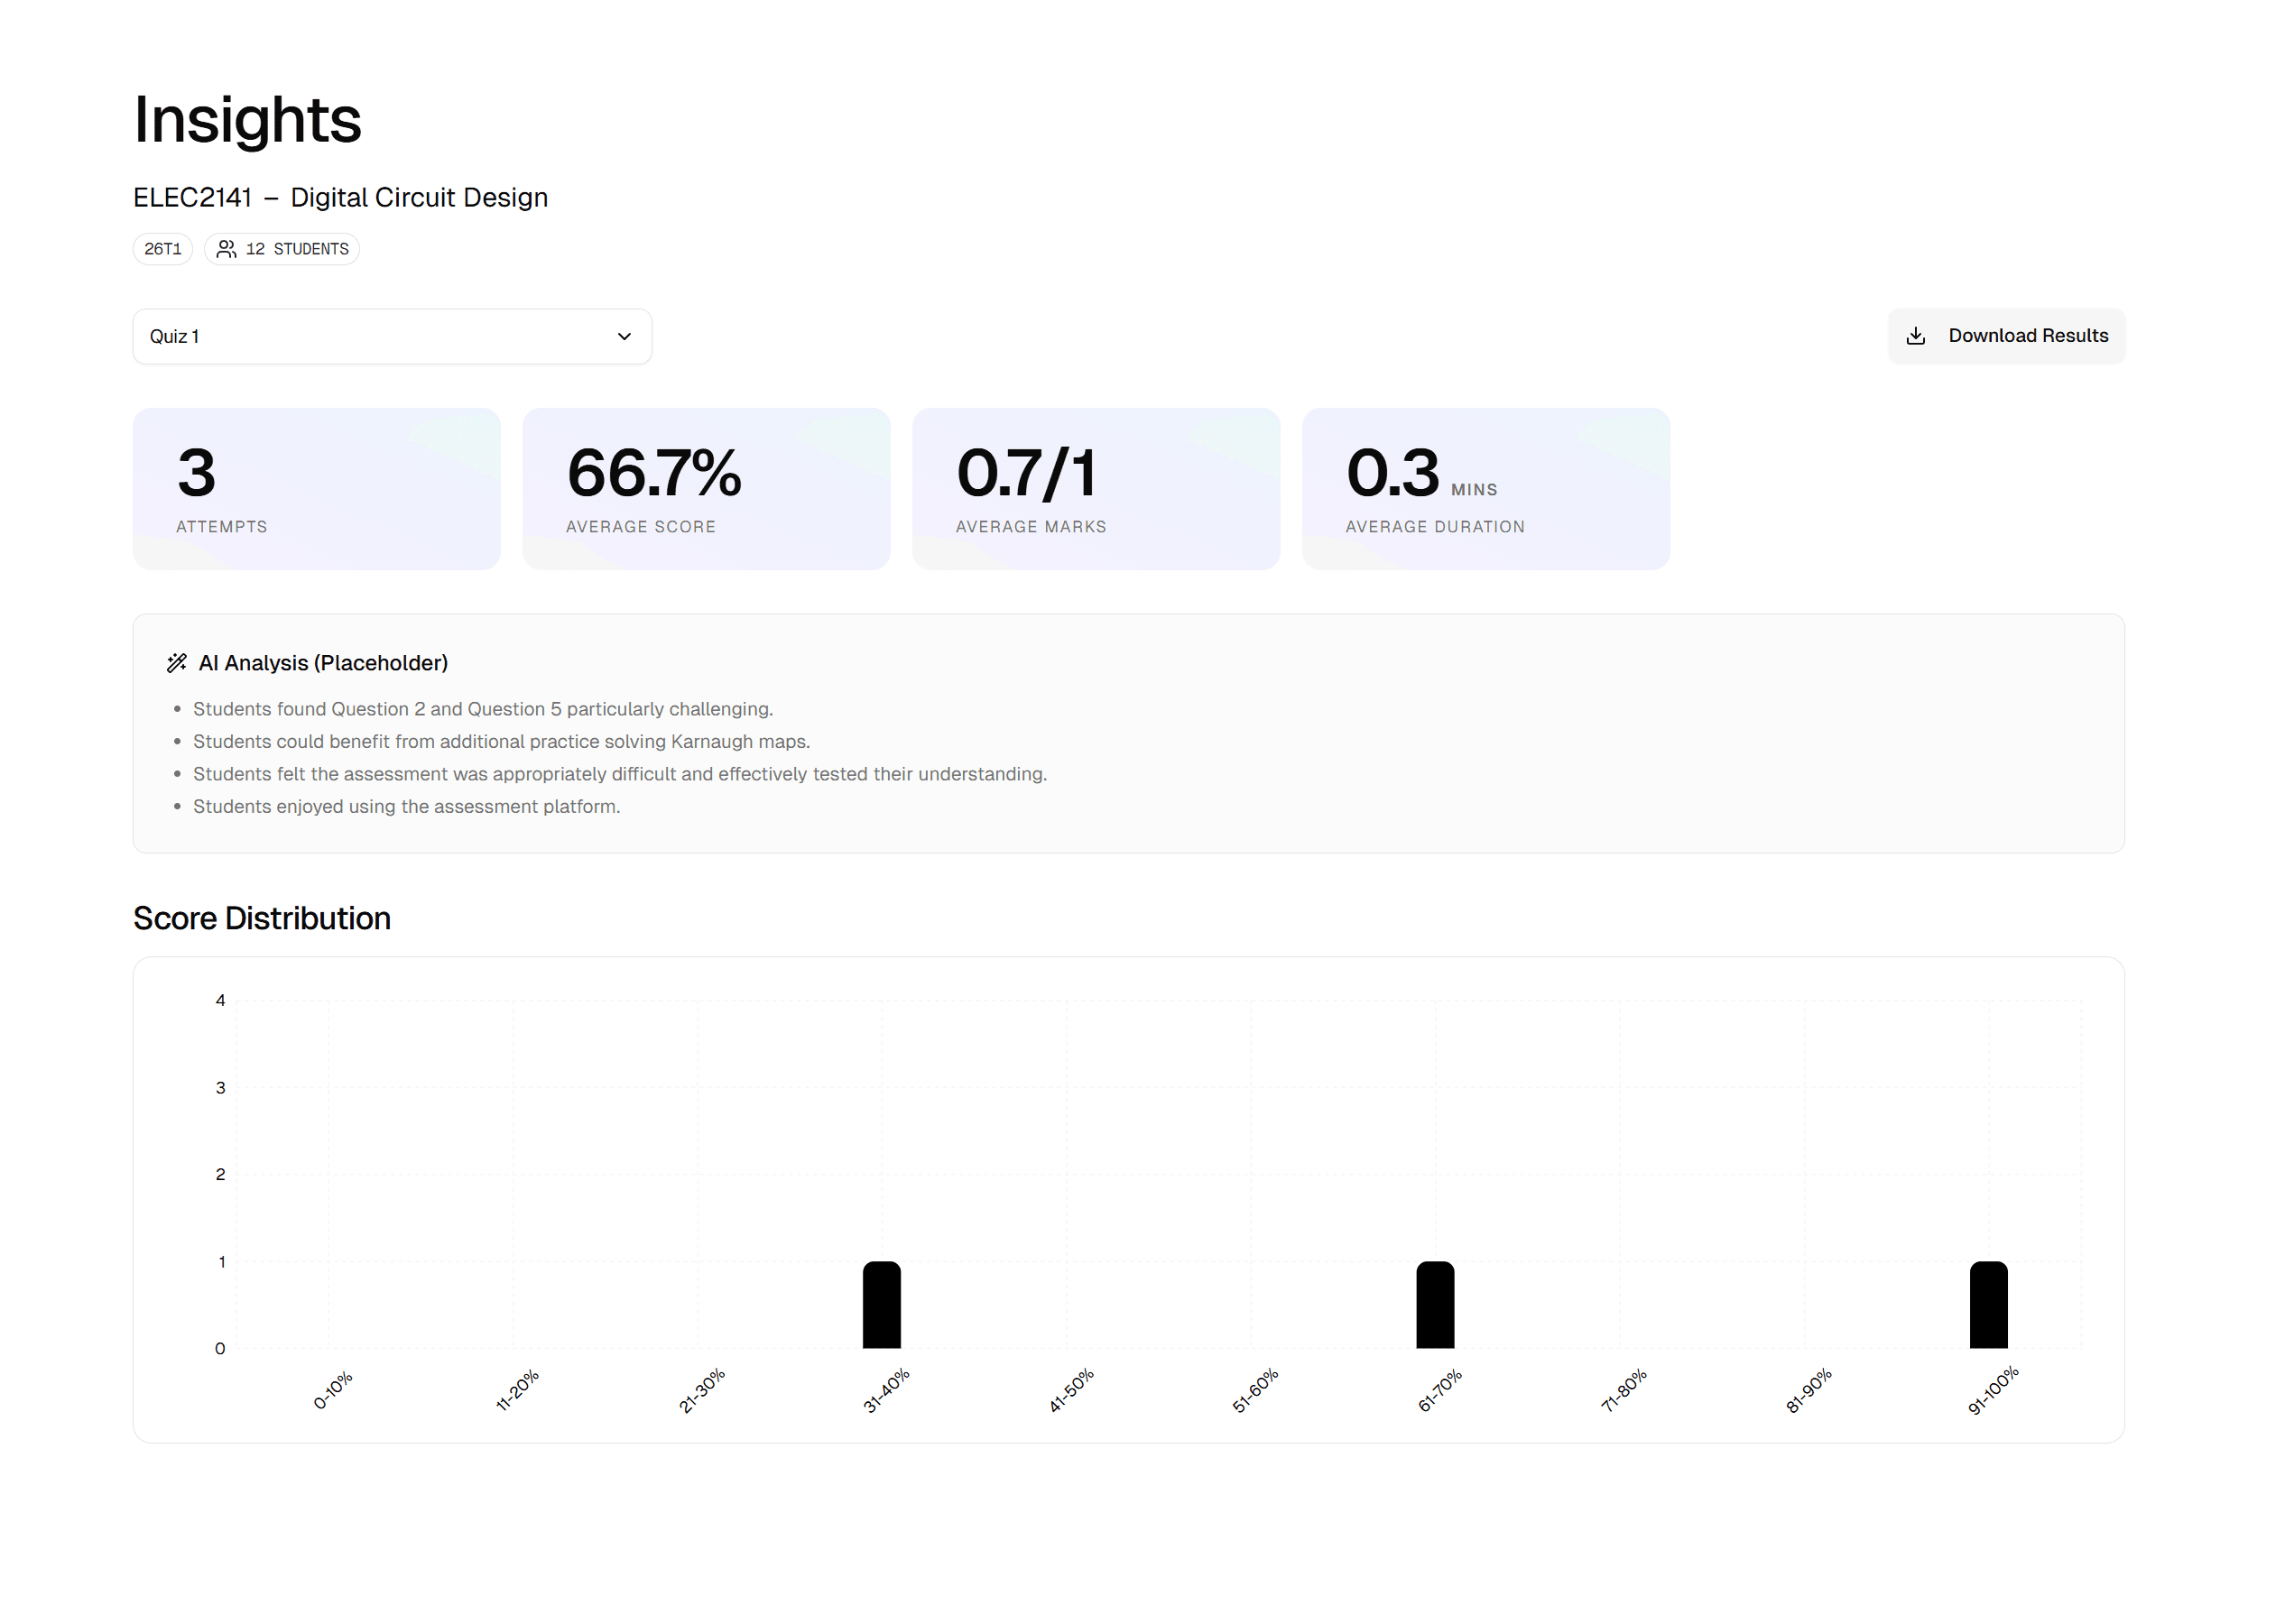
Spotting patterns
The Score Distribution chart visualises the spread of marks across your cohort.
What to look for:
- A bell curve: Indicates a well-balanced assessment that separates high achievers from the rest.
- A spike at the bottom (left): Students may be struggling with a specific concept or question type.
- A spike at the top (right): The assessment might be too easy to effectively test mastery.
Acting on data
Use these insights to refine your teaching. If the average is low, you might review that topic in the next lecture. If a specific question is consistently answered incorrectly, check if the question itself is unclear or misleading.
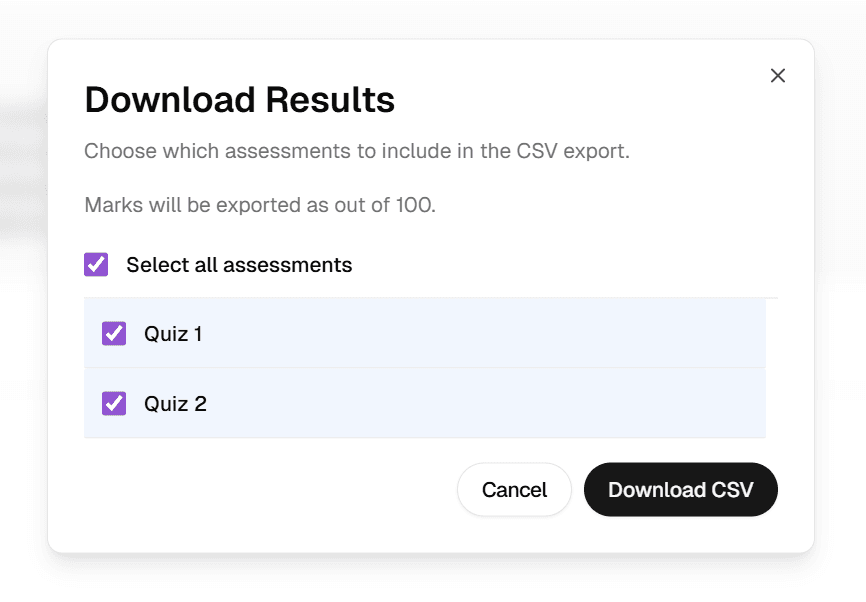
Exporting marks
To export student marks for your Moodle Gradebook, click the Download Results button shown in the previous screenshot. You should then be prompted to the following pop-up, allowing you to download the results as CSV.